 <>
<>
For the background to this page, please see the other stub matching page.
An unmatched load, on a lossless transmission line, generates a reflection. It is possible to cancel out this reflection by adding an equal and opposite reflection from a side arm or stub, at least over a narrow range of frequency close to the design point. This page illustrates the use of the SMITH chart in a simple series stub matching calculation.
More often stubs are used in shunt with the transmission line which is connected to the load. The SMITH chart is then used in a completely analagous manner as an admittance calculator.
In Waveguide, there is a special combination of series and shunt stub, connected to a hybrid tee junction, which is called an E-H tuner. Such a device can match any load at a spot frequency.
A stub consists of a side section of line attached in series with (or in shunt with) the main transmission line, at a point to be determined. The length of the line, and the point of attachment, both need to be calculated from the load impedance. The stub needs to be nearly lossless; it may be open circuit, or short circuit, or indeed terminated in a pure reactance.
The voltages and/or currents in the matching section, which consists of the stub and the section of line between the point of attachment of the stub and the load, may be much higher than on the transmission line feed; the waves bounce backwards and forwards between the load and the far end of the stub (the geometry is a kind of resonator); the feed excites the resonance and the resonance excites the load.
In terms of circuit theory, the stub and line may be regarded as a kind of LC matching section equivalent. It is also possible to design LC matching networks using the SMITH chart methods.
To consider stub matching it helps to have a practical example. Here, we study a load formed by an antenna which is being used away from its design frequency. (In a real installation, it may be easier to add a stub match to the feed structure rather than altering the antenna geometry). The method is not restricted to antenna loads.
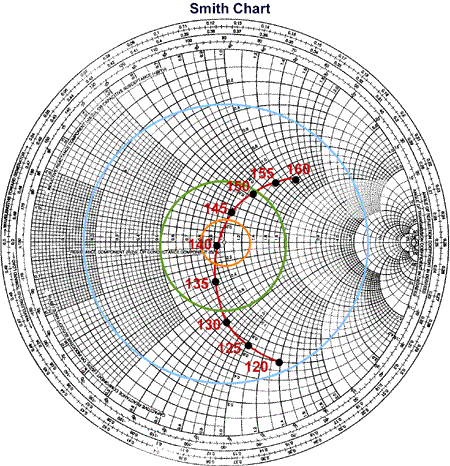
Below is a plot of the impedance of a one-metre long dipole antenna, made from 1 cm diameter aluminium tubing, as the frequency is changed from 120MHz to 160MHz. The plot is made on the SMITH chart. The impedance values are obtained from a NEC (Numerical Electromagnetic Code) computer calculation. We have normalised the actual impedance R + jX (the driving point impedance of the antenna at its centre) to the nominal characteristic impedance Zo = 75 ohms of a coaxial cable feed. Having simulated the antenna in NEC2 (The antenna is divided into 21 segments, and fed in the middle) to obtain R and X at a range of frequencies, we plot the values r and x on the SMITH chart, where r = R/Zo and x = X/Zo are the dimensionless normalised resistance and normalised reactance values. Note that the calculation will give different results for any other line impedance (it could, for instance, be 50 ohm coaxial cable or 300 ohm ribbon feeder).
For a 1 metre long dipole, the frequency at which it is exactly one half-wavelength in length is 150MHz. We see, as expected, that the closest approach to the centre of the SMITH chart (near where the red curve crosses the x=0 line) is a few percent below this frequency, at 140 MHz. So-called "half wave dipoles" are always cut a little short for resonance. To get an idea of the intrinsic bandwidth of this dipole, we have plotted three circles on the SMITH chart. The orange (innermost) circle represents VSWR = 1.33, and at this VSWR only 2% of the power incident on the antenna (from the feed) is reflected back along the feed to the transmitter; the remaining 98% is radiated. For navigational understanding on the SMITH chart, the distance out from the centre of the chart to the orange circle is 0.141 of the distance from centre to perimeter. This is because the square root of 2% = 0.02 is 0.141, which is the modulus or size of the reflection coefficient gamma. We estimate the bandwidth for which there is more than 98% transmitted as 137-144 MHz. The green (middle) circle represents VSWR = 1.93, and at this VSWR, 10% of the incident power is reflected and 90% transmitted. From the plot we estimate the bandwidth for which there is more than 90% transmitted power as 132-151 MHz. The blue (outer) circle represents VSWR = about 6, at which there is 50% reflected power, and 50% transmitted power. At this value of VSWR the antenna is significantly mismatched, and the feed loss will be high because of the large VSWR.
If we look at the SMITH chart we find a circle of constant real normalised impedance r=1 which goes through the open circuit point and the centre of the chart. In our example in the next picture, this circle is drawn in red. If you plot any arbitrary normalised impedance on the SMITH chart, and follow round clockwise at constant radius, from the centre of the SMITH chart, towards the generator (along the green line in the example), you must cross the r=1 circle somewhere. This transformation at constant radius represents motion along the transmission line towards the generator. (One complete circuit of the SMITH chart represents a travel of one half wavelength towards the generator.) At this intersection point the generalised arbitrary load impedance r + jx has transformed to (1+jx'), so, at least the real part of the impedance equals the characteristic impedance of the line. Matching has not yet been achieved because of the residual reactance x' which must be tuned out with the stub. Note that x' is different from x in general. For each transformation around the SMITH chart, representing travel one half wavelength towards the transmitter, there are two intersections with the r=1 circle. Stubs may be placed at either of these points.
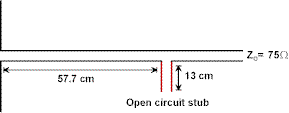
In the example above, we have plotted the impedance of a 1 metre dipole antenna at 120 MHz, which is 44.8 ohms - j 107 ohms, as the a single point at normalised impedance 0.597 - j 1.43 with respect to the 75 ohm coaxial line. We shall determine the position and length of a series stub which will match this antenna to the transmission line. To see the physical geometry of the stub, please look at this figure.
At the transformed (see above) intersection point (red and green circles) the line is cut and a pure reactance -jx' is added. This is done by creating this reactance -jx' using a series-connected lossless stub. Now, the total impedance looking into the sum of the line impedance (which is 1+jx') and -jx' is therefore (1+jx') -jx' = 1 and the line is matched.
Why stubs? Stubs are shorted or open circuit lengths of transmission line which produce a pure reactance at the attachment point. Any value of reactance can be made, as the stub length is varied from zero to half a wavelength.
Again, one looks at the SMITH chart and finds the outer circle where the modulus of the reflection coefficient is unity. On this circle are the SHORT and OPEN points, and all values of positive (top half of the SMITH chart) and negative (bottom half of the SMITH chart) reactance. The resistance is zero everywhere. It has to be zero, as a lossless transmission line with load infinity ohms (open) or zero ohms (short) has no mechanism for absorbing power. To generate a specified reactance, start at a short circuit (or maybe an open circuit) and follow the rim of the SMITH chart clockwise around towards the generator until the desired reactance is obtained. Cut the stub this number of wavelengths long.
In our example, the SMITH chart construction to find the stub length is shown in the next picture.
From the blue arc in the previous picture we see that the reactance at the r=1 intersection point is +j1.86, so to cancel this out we must add a series stub having reactance -j1.86. In the next figure we plot the blue arc -j1.86 and, starting from the short circuit (r = x = 0) we follow the green line around a distance of 0.328 wavelengths clockwise towards the generator, to generate this value of reactance. If we had started from an open circuit we would only travel a distance (0.328 - 0.250) = 0.078 wavelengths to generate this reactance. This open circuit stub is represented by the red arc.
The practical details of the series stub match are shown below, where we display the physical lengths in centimetres, assuming a wave velocity on the coax (which we need to know to do this calculation) of 2x10^8 metres per second. This data is supplied by the cable manufacturer. The wave velocity and the frequency (120 MHz) allows us to calculate the wavelength in metres, and thus we can translate the "electrical lengths" from the SMITH chart into physical lengths of line.

      Actual dimensions.

      Suppose that the 75 ohm cable has a velocity factor 2/3 or 0.67

      The wave velocity is 2E8 metres per second

      The wavelength at 120 MHz is 167 cms

      The stub position is 0.346 lambda (57.7 cm) from the load (antenna)

      The length of the required shorted stub is 0.328 lambda = 54.7 cm

                   or we could use an open circuit stub....

      The length of the required open stub is (0.328-0.250)lambda = 13.0 cm
Notice also that series matches in coaxial cable are difficult to make, for physical reasons. Series matches are much more appropriate to balanced feeder (possibly 300 ohm ribbon cable); our example could have been a 300 ohm balanced twin feeder supplying a 300 ohm (nominal) folded dipole.
Shunt matches are dealt with very similarly. One uses the property of the SMITH chart, that it can be used equally well as an impedance calculator or an admittance calculator. Admittances in parallel add; impedances in series add. Thus the calculation proceeds identically for a shunt stub match, with the transposition of impedance and admittance, and the transposition of series and shunt.
It is important to keep the total stub length as short as possible, if wider bandwidths are required. Every time you add a half wavelength to the stub length the reactance of the stub comes back to the same value. It is good design practice to make stubs in the range 0 to 0.5 wavelengths long. However, this may require an impractically short stub, so then one can make the stub just a little over 0.5 wavelengths long.
Short or open stubs?
If one is allowed to use either short or open stubs at will, one can always keep the total stub length in the range 0-0.25 wavelengths. A length of transmission line of 0.25 wavelengths takes us half way round the SMITH chart and transforms an open into a short, or vice versa. On microstrip, it is usually easier to leave stubs open circuit, for constructional reasons. On coax line or parallel wire line, a short circuit stub has less radiation from the ends: it is difficult to make a perfect non-radiating open circuit as there are always some end effects on the line.

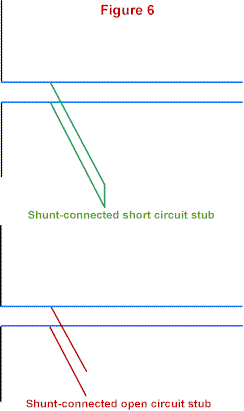
The stub illustrated above is called a "series stub". In parallel wire line, it is connected in series with one of the wires of the feed, as shown in figures 4 and 5. More usual (in coax, at least) is to use a "shunt stub", which is connected across the two wires of the feed, as shown in figure 6. Since admittances in parallel add, whereas impedances in series add, we represent the transmission line impedance as an admittance y = g + js at the point of attachment, and we look for the g=1 circle. This is 180 degrees (a quarter-wavelength) around the SMITH chart from the r=1 impedance circle. Therefore, the points of attachment of shunt stubs are a quarter wavelength along the transmission line, either side of the points of attachment of a series stub. The stub line length needs to be different also as we need to compensate the parallel js with an equal and opposite shunt susceptance -js, and the value of susceptance s is different from the value of reactance x in the series-match example.
As the frequency changes, the wavelength changes and the electrical length and point of attachment of the stub also changes. Thus, a stub match is only accurate at a single spot frequency, and as the frequency changes it becomes progressively less good. However, for a given power reflection coefficient (say less than 10% of power reflected) the match may be sufficiently good over the required range of frequency. Also, the addition of a stub match can, under certain circumstances, even increase the effective bandwidth of the system for a given reflection coefficient.
Stub matching is only desirable for relatively low fractional bandwidths. For wider bandwidth matching a multi-section quarter wave transformer can be used, or a tapered line. Impedance matching may be carried out using the SMITH chart for calculations and design, and lumped components taking the place of lengths of transmission line. It is possible to make undesirable reflections by using a "wrong" stub match, so care must be taken in applying stub matching in high power (e.g. transmitting) applications. It is always wise to measure the match before applying significant input power. In antenna matching situations significant mismatch can arise from alterations to the near-field environment of the antenna over time. Thus if a new antenna is added to an existing mast, it is always wise to check the matching of the pre-existing antennas.
Notice that the characteristic impedance of the stub lines can be different from the characteristic impedance of the feed line. If this is the case, we use the "stub line Zo" to "un-normalise" its reactance, and we renormalise the reactance to the "feed line Zo". What this means is that the stub lengths vary(depending on their characteristic impedance) but this doesn't affect the point of attachment to the stubs. This is useful; the flexible coax feed may have a dielectric spacer and the rigid sliding-short double-stub tuner is probably air-spaced.
Acknowledgement. This page is amended from an article reworked for antenneX magazine and the pictures have been redrawn using their technical expertise. The Author is indebted to the draughtsmen at antenneX. Interested readers are directed to the original article for more detail. Unlike that article, this version is undergoing a continual process of revision.